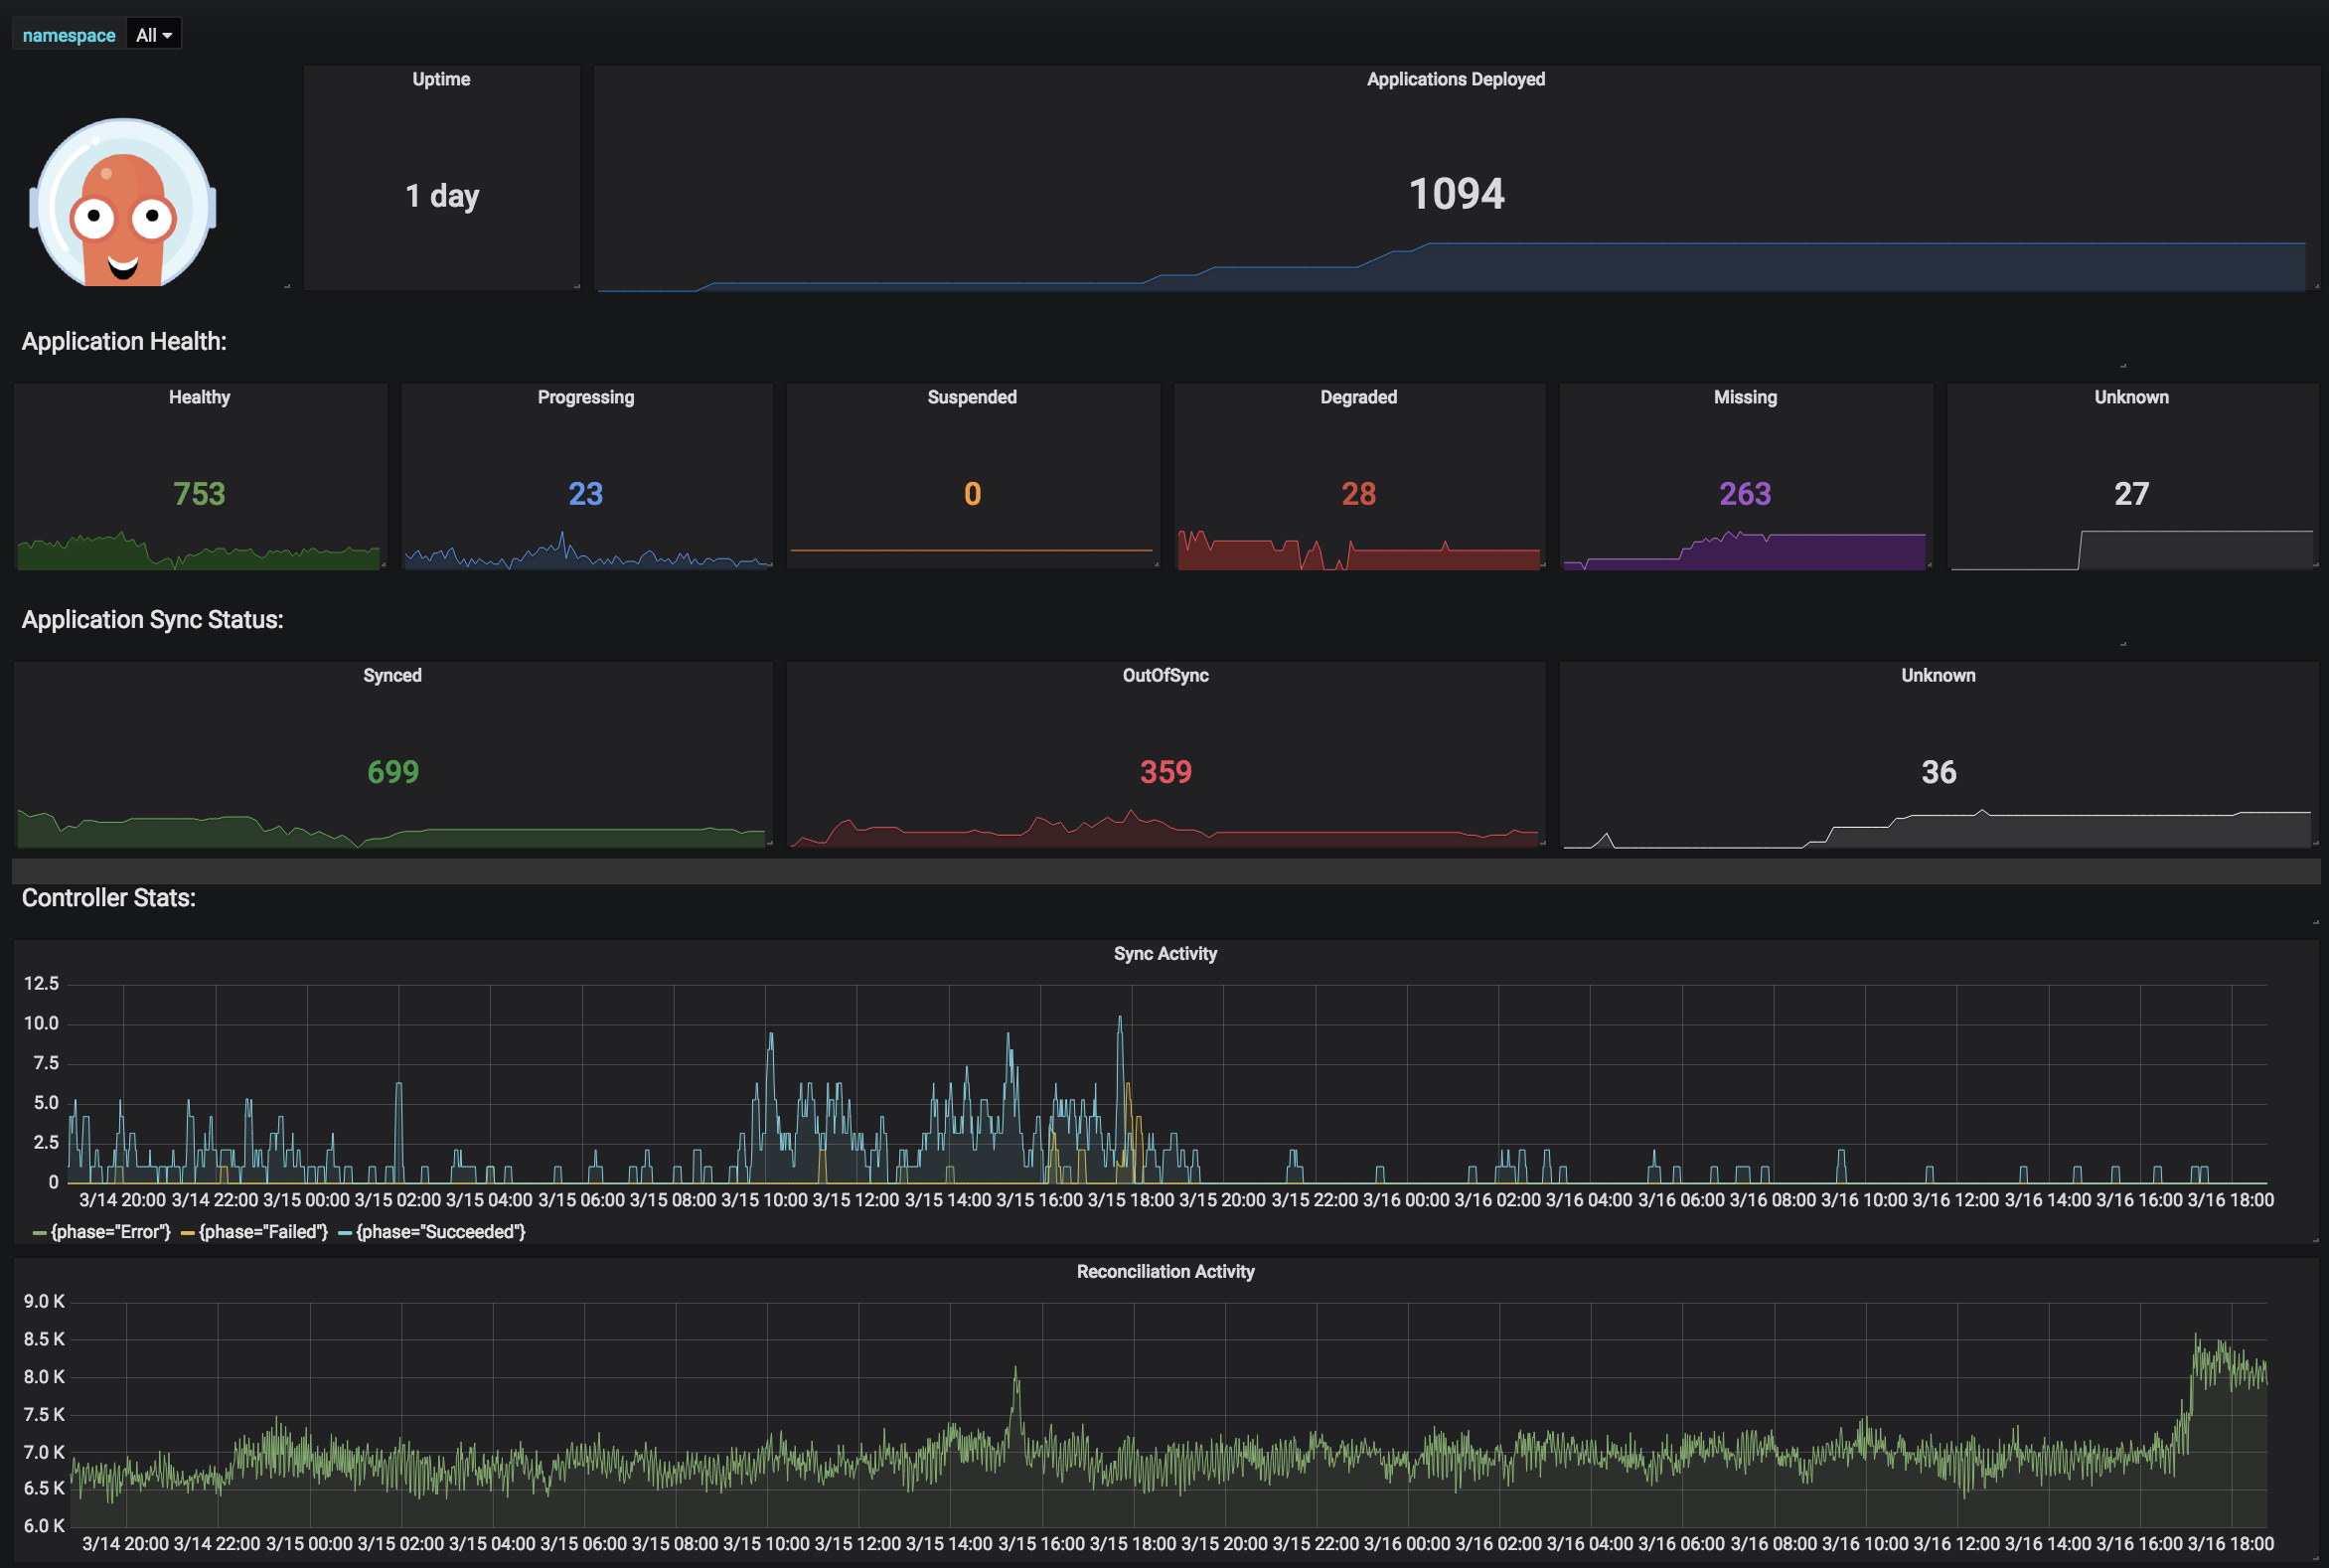
github.com/argoproj/argo-cd@v1.8.7/docs/operator-manual/metrics.md (about) 1 # Metrics 2 3 Argo CD exposes two sets of Prometheus metrics 4 5 ## Application Metrics 6 Metrics about applications. Scraped at the `argocd-metrics:8082/metrics` endpoint. 7 8 * Gauge for application health status 9 * Gauge for application sync status 10 * Counter for application sync history 11 12 ## API Server Metrics 13 Metrics about API Server API request and response activity (request totals, response codes, etc...). 14 Scraped at the `argocd-server-metrics:8083/metrics` endpoint. 15 16 ## Prometheus Operator 17 18 If using Prometheus Operator, the following ServiceMonitor example manifests can be used. 19 Change `metadata.labels.release` to the name of label selected by your Prometheus. 20 21 ```yaml 22 apiVersion: monitoring.coreos.com/v1 23 kind: ServiceMonitor 24 metadata: 25 name: argocd-metrics 26 labels: 27 release: prometheus-operator 28 spec: 29 selector: 30 matchLabels: 31 app.kubernetes.io/name: argocd-metrics 32 endpoints: 33 - port: metrics 34 ``` 35 36 ```yaml 37 apiVersion: monitoring.coreos.com/v1 38 kind: ServiceMonitor 39 metadata: 40 name: argocd-server-metrics 41 labels: 42 release: prometheus-operator 43 spec: 44 selector: 45 matchLabels: 46 app.kubernetes.io/name: argocd-server-metrics 47 endpoints: 48 - port: metrics 49 ``` 50 51 ```yaml 52 apiVersion: monitoring.coreos.com/v1 53 kind: ServiceMonitor 54 metadata: 55 name: argocd-repo-server-metrics 56 labels: 57 release: prometheus-operator 58 spec: 59 selector: 60 matchLabels: 61 app.kubernetes.io/name: argocd-repo-server 62 endpoints: 63 - port: metrics 64 ``` 65 66 ## Dashboards 67 68 You can find an example Grafana dashboard [here](https://github.com/argoproj/argo-cd/blob/master/examples/dashboard.json) or check demo instance 69 [dashboard](https://grafana.apps.argoproj.io). 70 71 