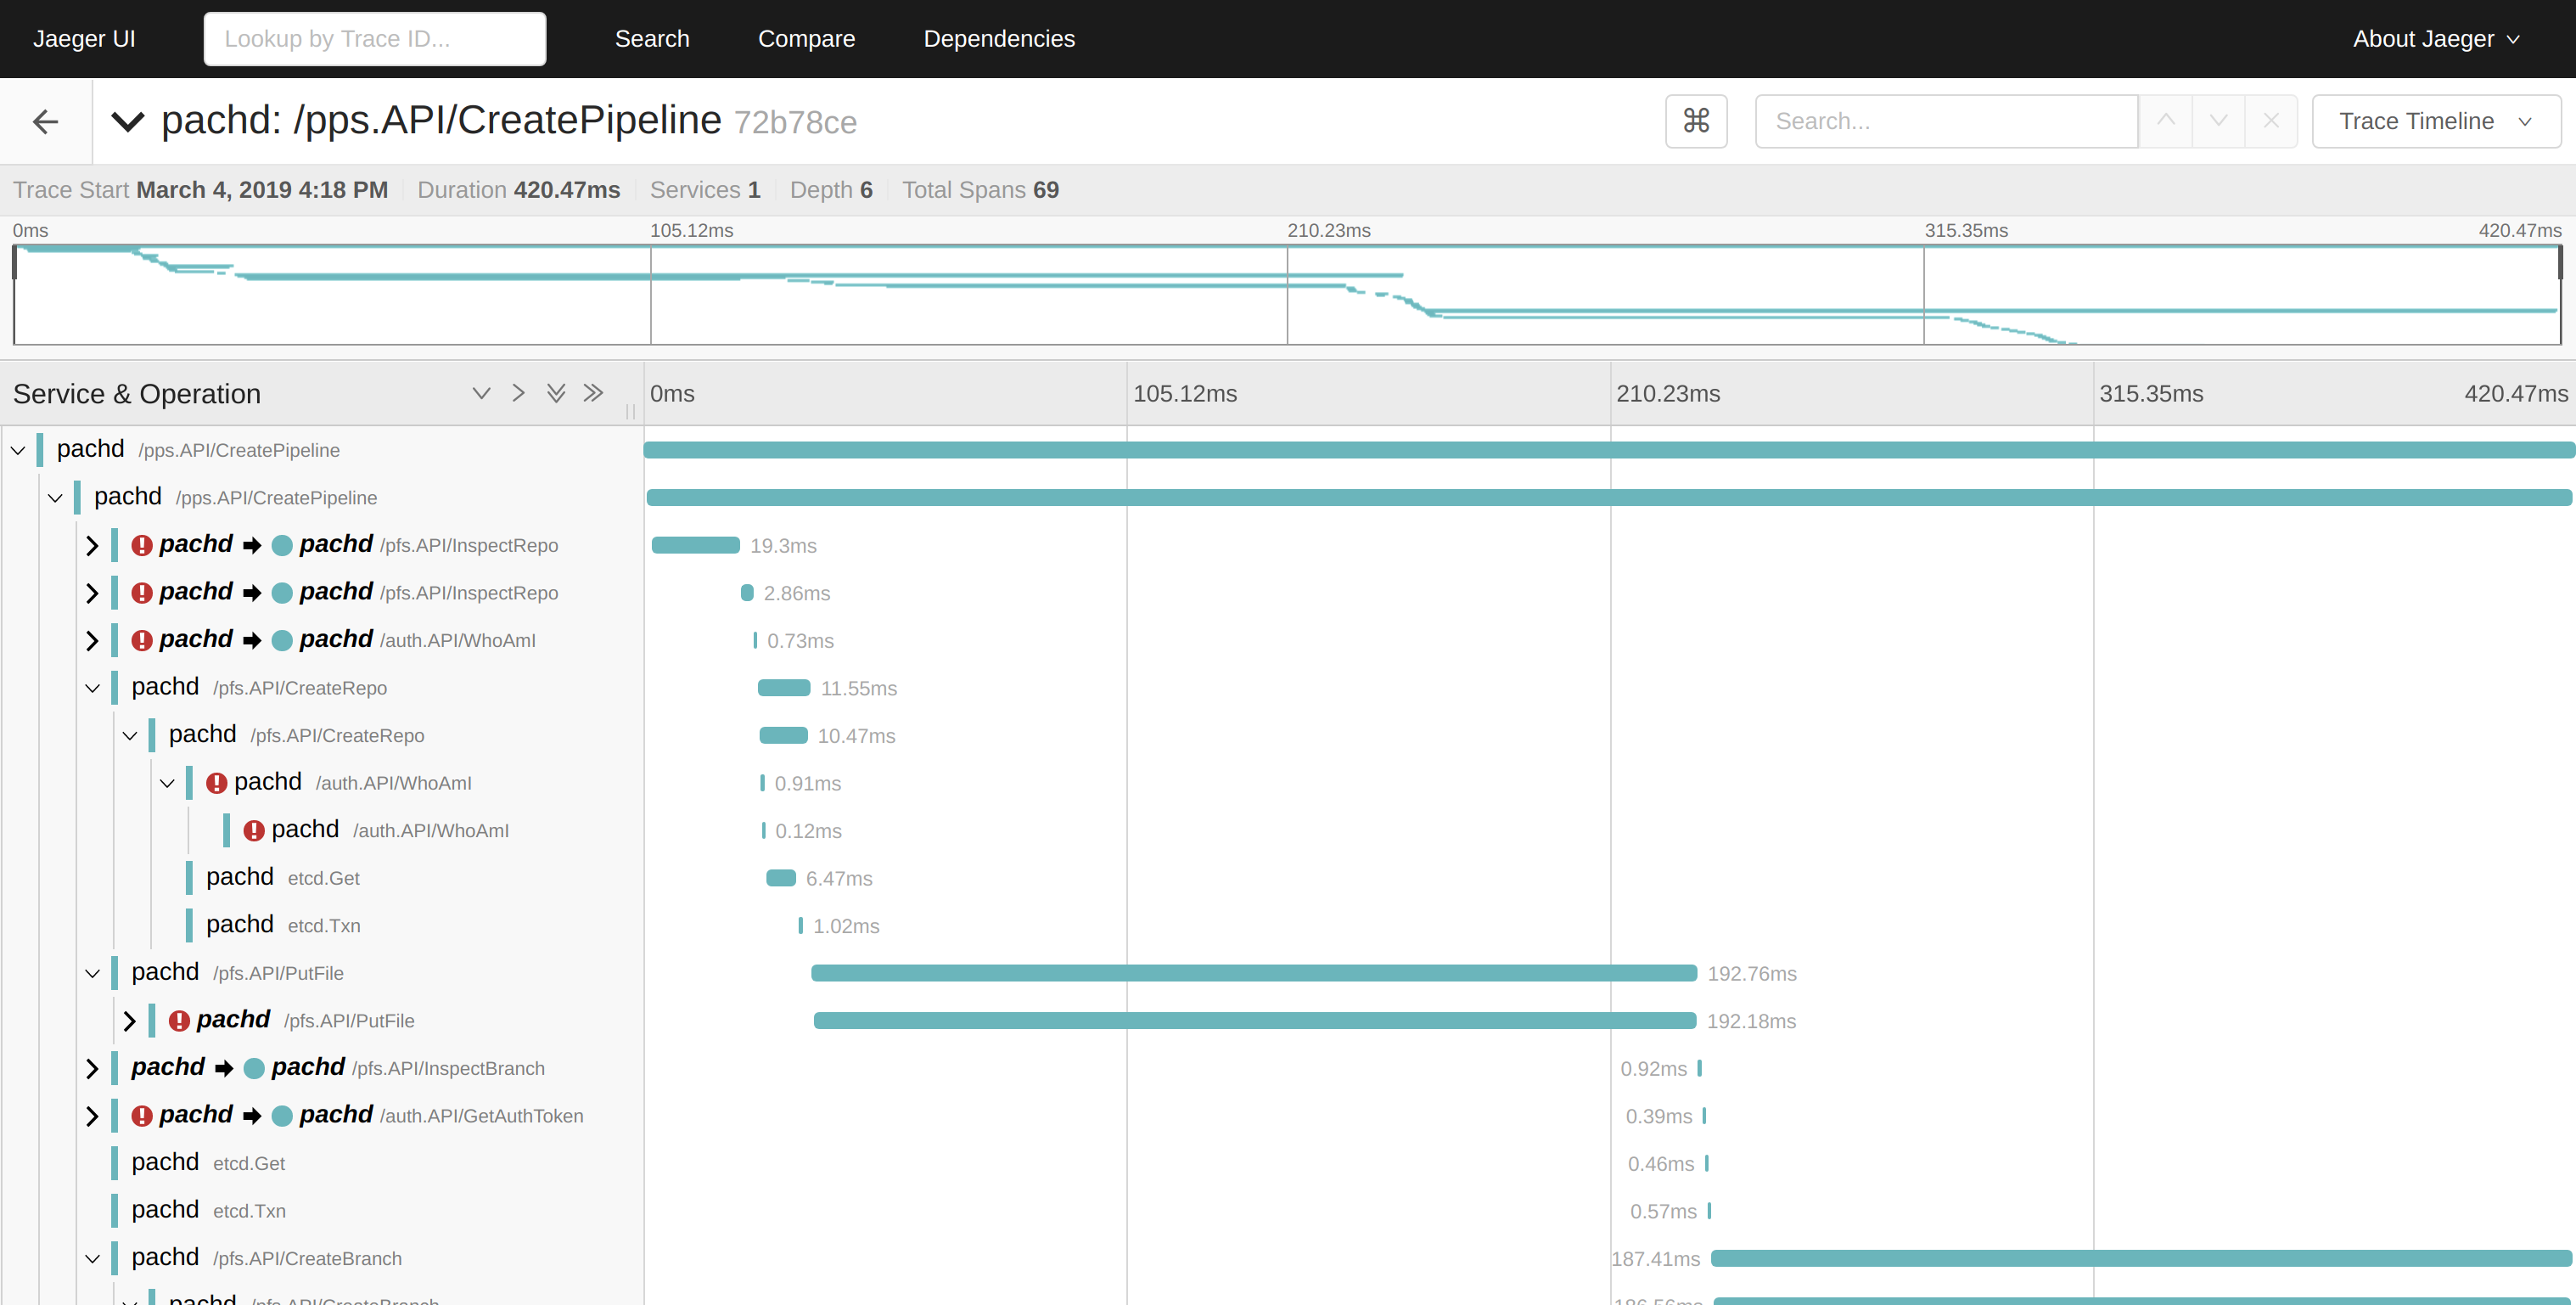
github.com/pachyderm/pachyderm@v1.13.4/doc/docs/1.11.x/deploy-manage/deploy/tracing.md (about) 1 # Configure Tracing with Jaeger 2 3 Pachyderm has the ability to trace requests using Jaeger. This 4 can be useful when diagnosing slow clusters. 5 6  7 8 # Collecting Traces 9 10 To use tracing in Pachyderm, complete the following steps: 11 12 1. Run Jaeger in Kubernetes 13 14 ```shell 15 kubectl apply -f https://raw.githubusercontent.com/pachyderm/pachyderm/master/etc/deploy/tracing/jaeger-all-in-one.yaml 16 ``` 17 18 2. Point Pachyderm at Jaeger 19 20 * For `pachctl`, run: 21 22 ```shell 23 export JAEGER_ENDPOINT=localhost:14268 24 kubectl port-forward svc/jaeger-collector 14268 & # Collector service 25 ``` 26 27 * For `pachd`, run: 28 29 ``` 30 kubectl delete po -l suite=pachyderm,app=pachd 31 ``` 32 33 The port-forward command is necessary because `pachctl` sends traces to 34 Jaeger (it actually initiates every trace), and reads the `JAEGER_ENDPOINT` 35 environment variable for the address to which it will send the trace info. 36 37 Restarting the `pachd` pod is necessary because `pachd` also sends trace 38 information to Jaeger, but it reads the environment variables corresponding 39 to the Jaeger service[1] on startup to find Jaeger (the Jaeger service is 40 created by the `jaeger-all-in-one.yaml` manifest). Killing the pods 41 restarts them, which causes them to connect to Jaeger. 42 43 3. Send Pachyderm a traced request by setting the `PACH_TRACE` 44 environment variable to "true" before running any `pachctl` 45 command (note that `JAEGER_ENDPOINT` must also be 46 set/exported): 47 48 ``` 49 PACH_TRACE=true pachctl list job # for example 50 ``` 51 52 Pachyderm does not recommend exporting `PACH_TRACE` because 53 tracing calls can slow them down and make interesting traces hard 54 to find in Jaeger. Therefore, you might want to set this variable for 55 the specific calls you want to trace. 56 57 However, Pachyderm's client library reads this variable and implements the 58 relevant tracing, so any binary that uses Pachyderm's go client library can 59 trace calls if these variables are set. 60 61 ## View Traces 62 63 To view traces, run: 64 65 ``` 66 kubectl port-forward svc/jaeger-query 16686:80 & # UI service 67 ``` 68 69 Then, connect to `localhost:16686` in your browser, and you should see all 70 collected traces. 71 72 !!! note "See Also:" 73 [Kubernetes Service Environment Variables](https://kubernetes.io/docs/concepts/services-networking/service/#environment-variables) 74 75 ## Troubleshooting 76 77 1. If you see `<trace-without-root-span>`, this likely means that `pachd` has 78 connected to Jaeger, but `pachctl` has not. Make sure that the 79 `JAEGER_ENDPOINT` environment variable is set on your local machine, and 80 that `kubectl port-forward "po/${jaeger_pod}" 14268` is running. 81 82 2. If you see a trace appear in Jaeger with no subtraces, like so: 83 84  85 86 This might mean that `pachd` has not connected to Jaeger, but 87 `pachctl` has. Restart the `pachd` pods *after* creating the 88 Jaeger service in Kubernetes.